Denis Shirshov's
maps and charts
Hello! My name is Denis and I have come from Nikel, Petsamo.
Here is my graphics consisted primary from maps, but also with some interactive data visualizations
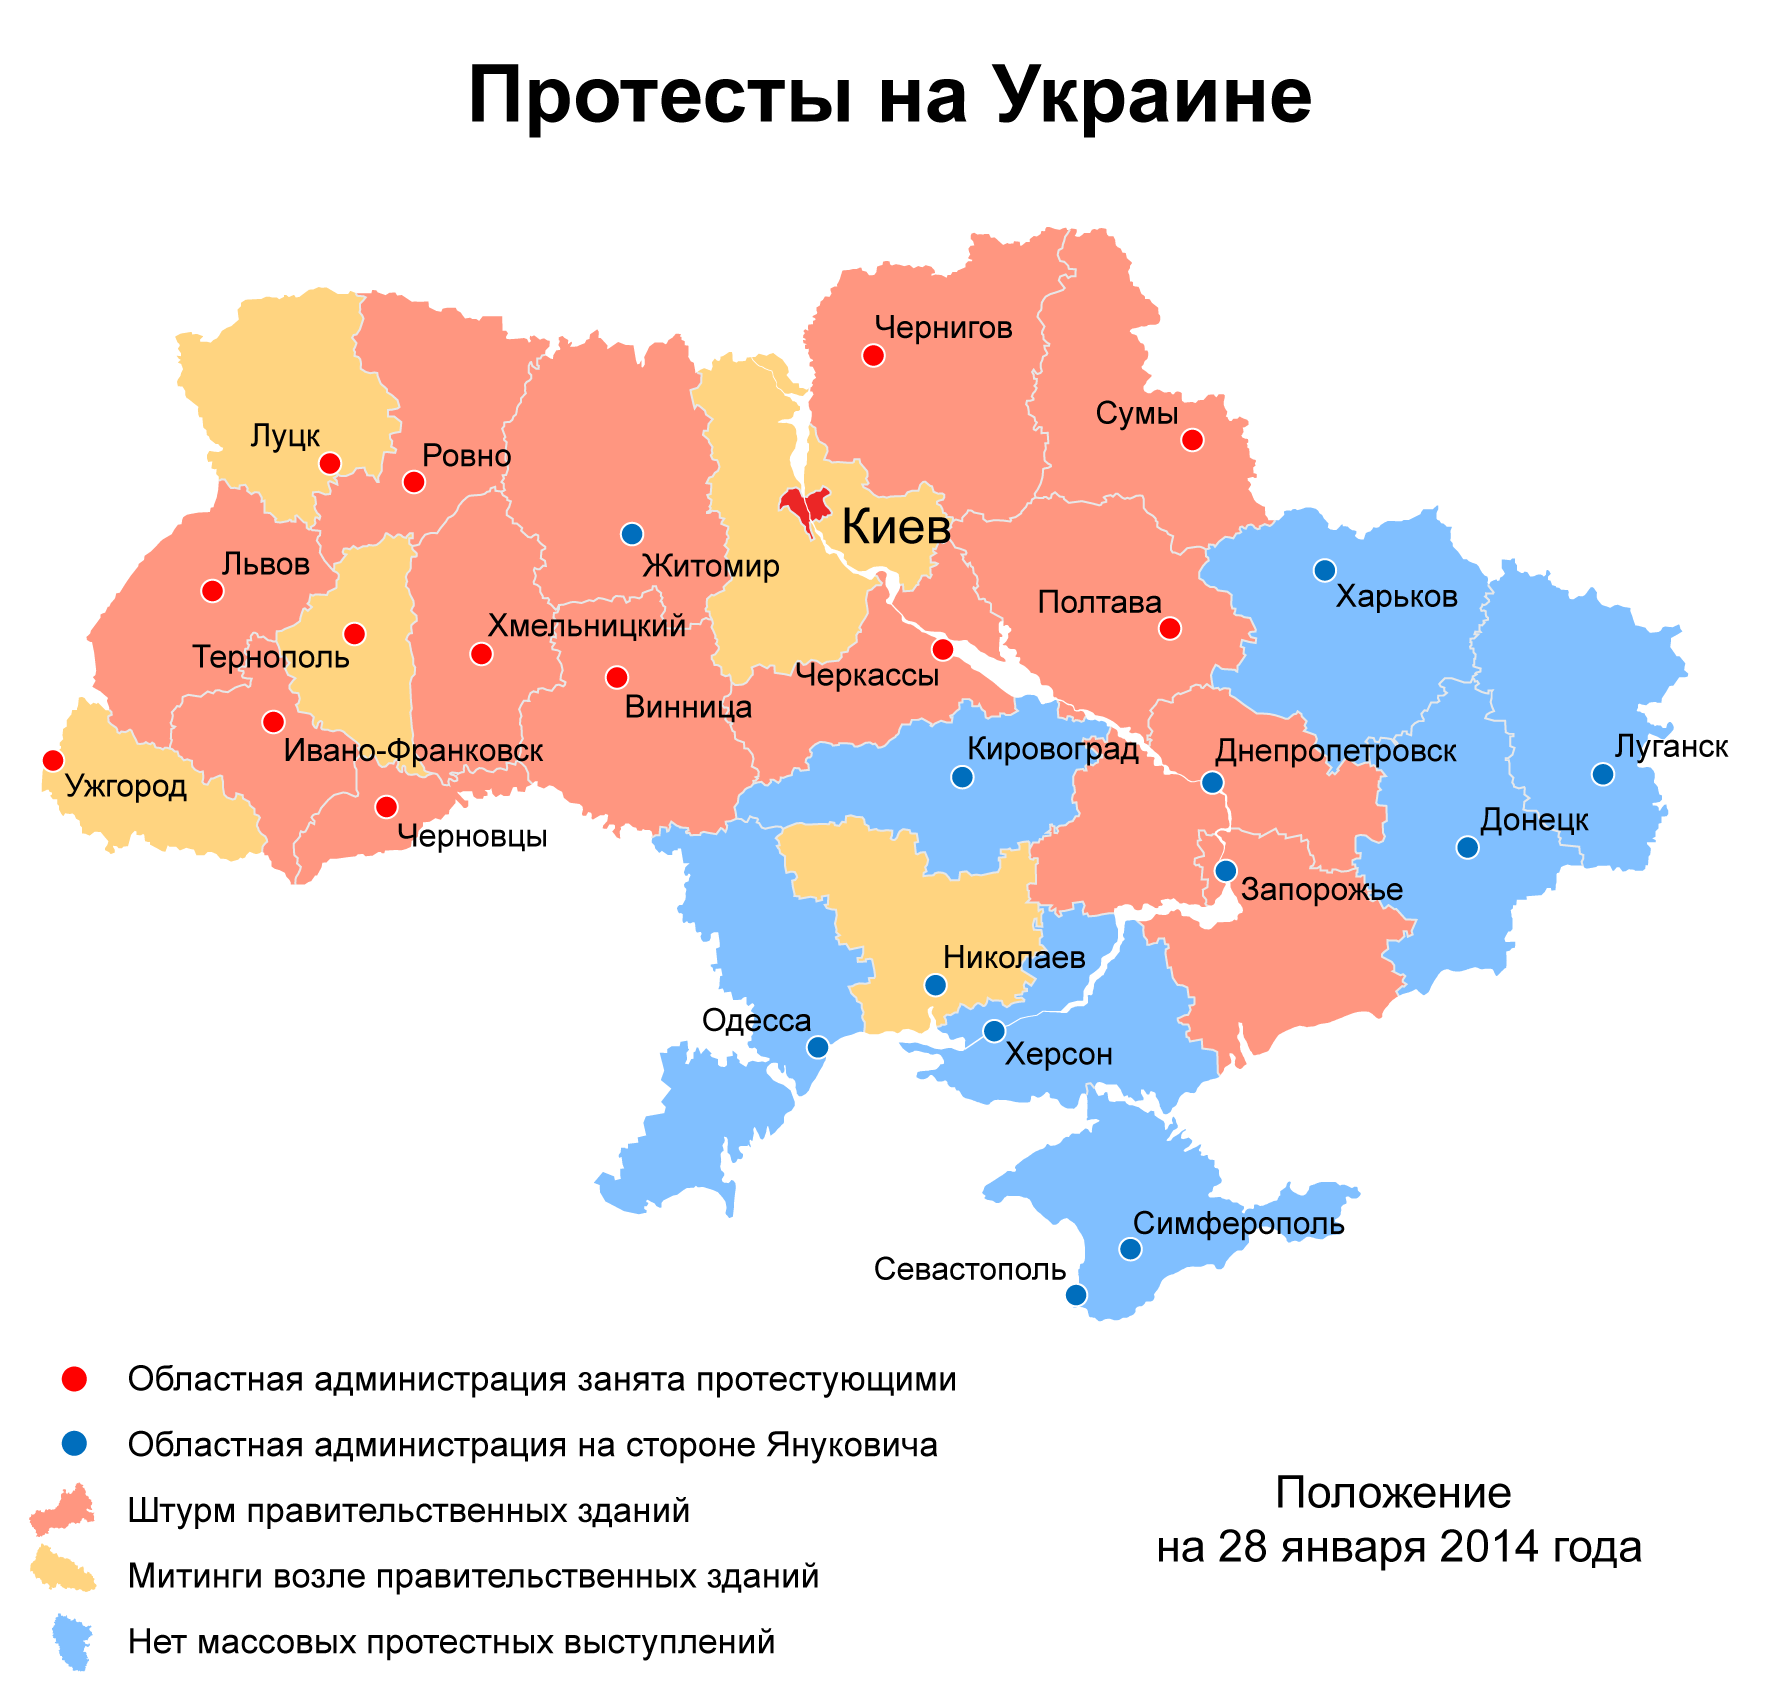
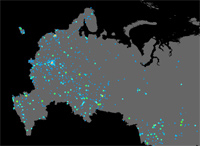
Protests in Ukraine.This kind of heatmap was very popular among many newspapers and websites in January 2014.
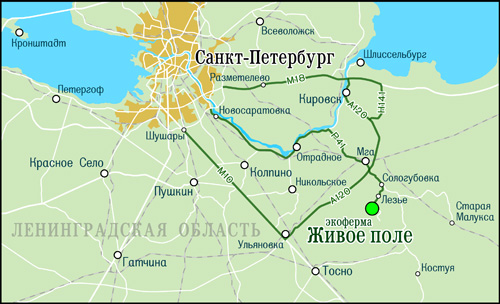
How-to-get mapEcofarm Green field near Saint-Petersburg. 2013.
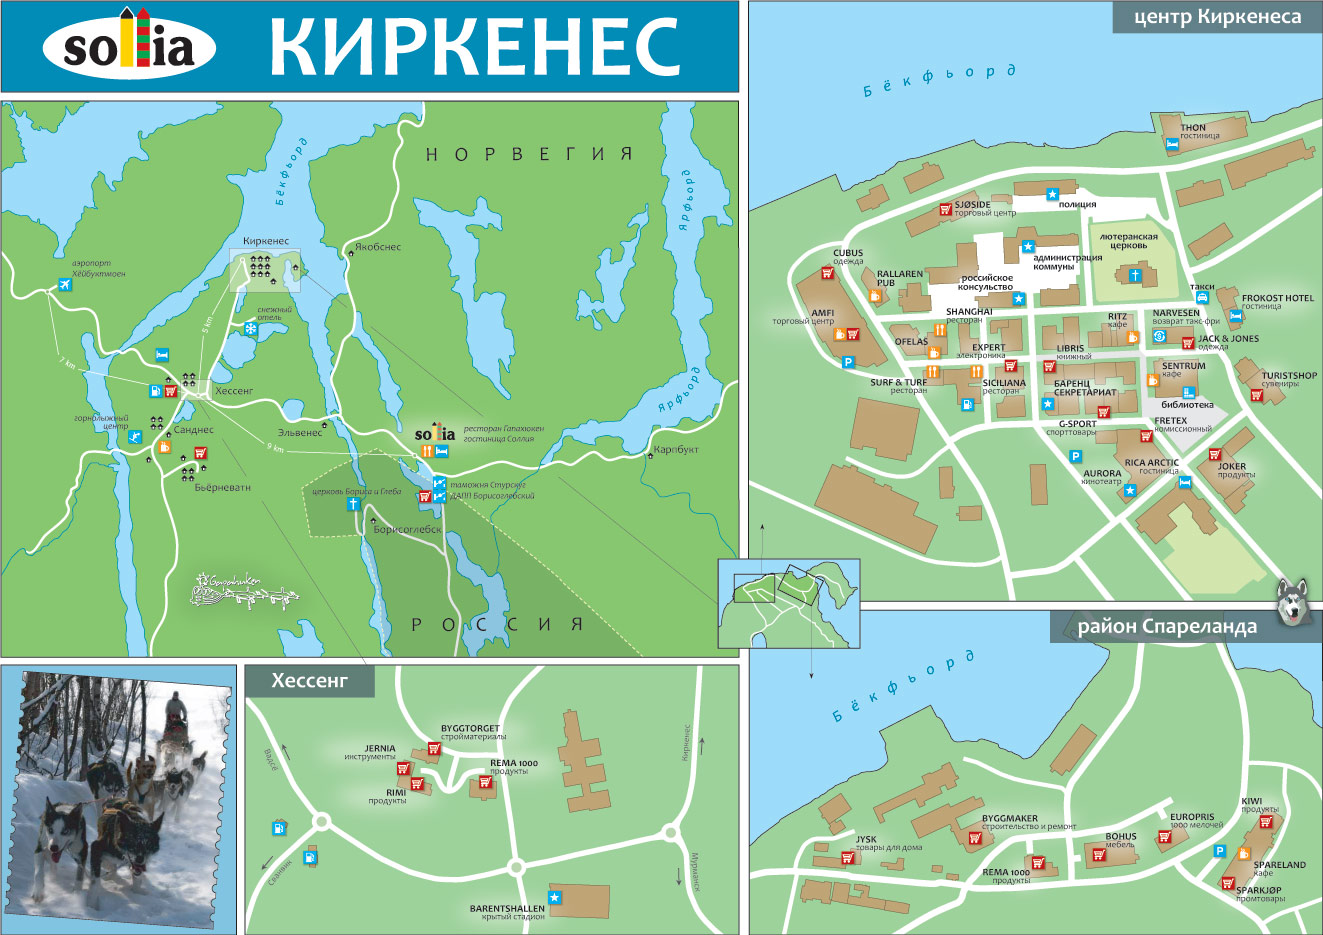
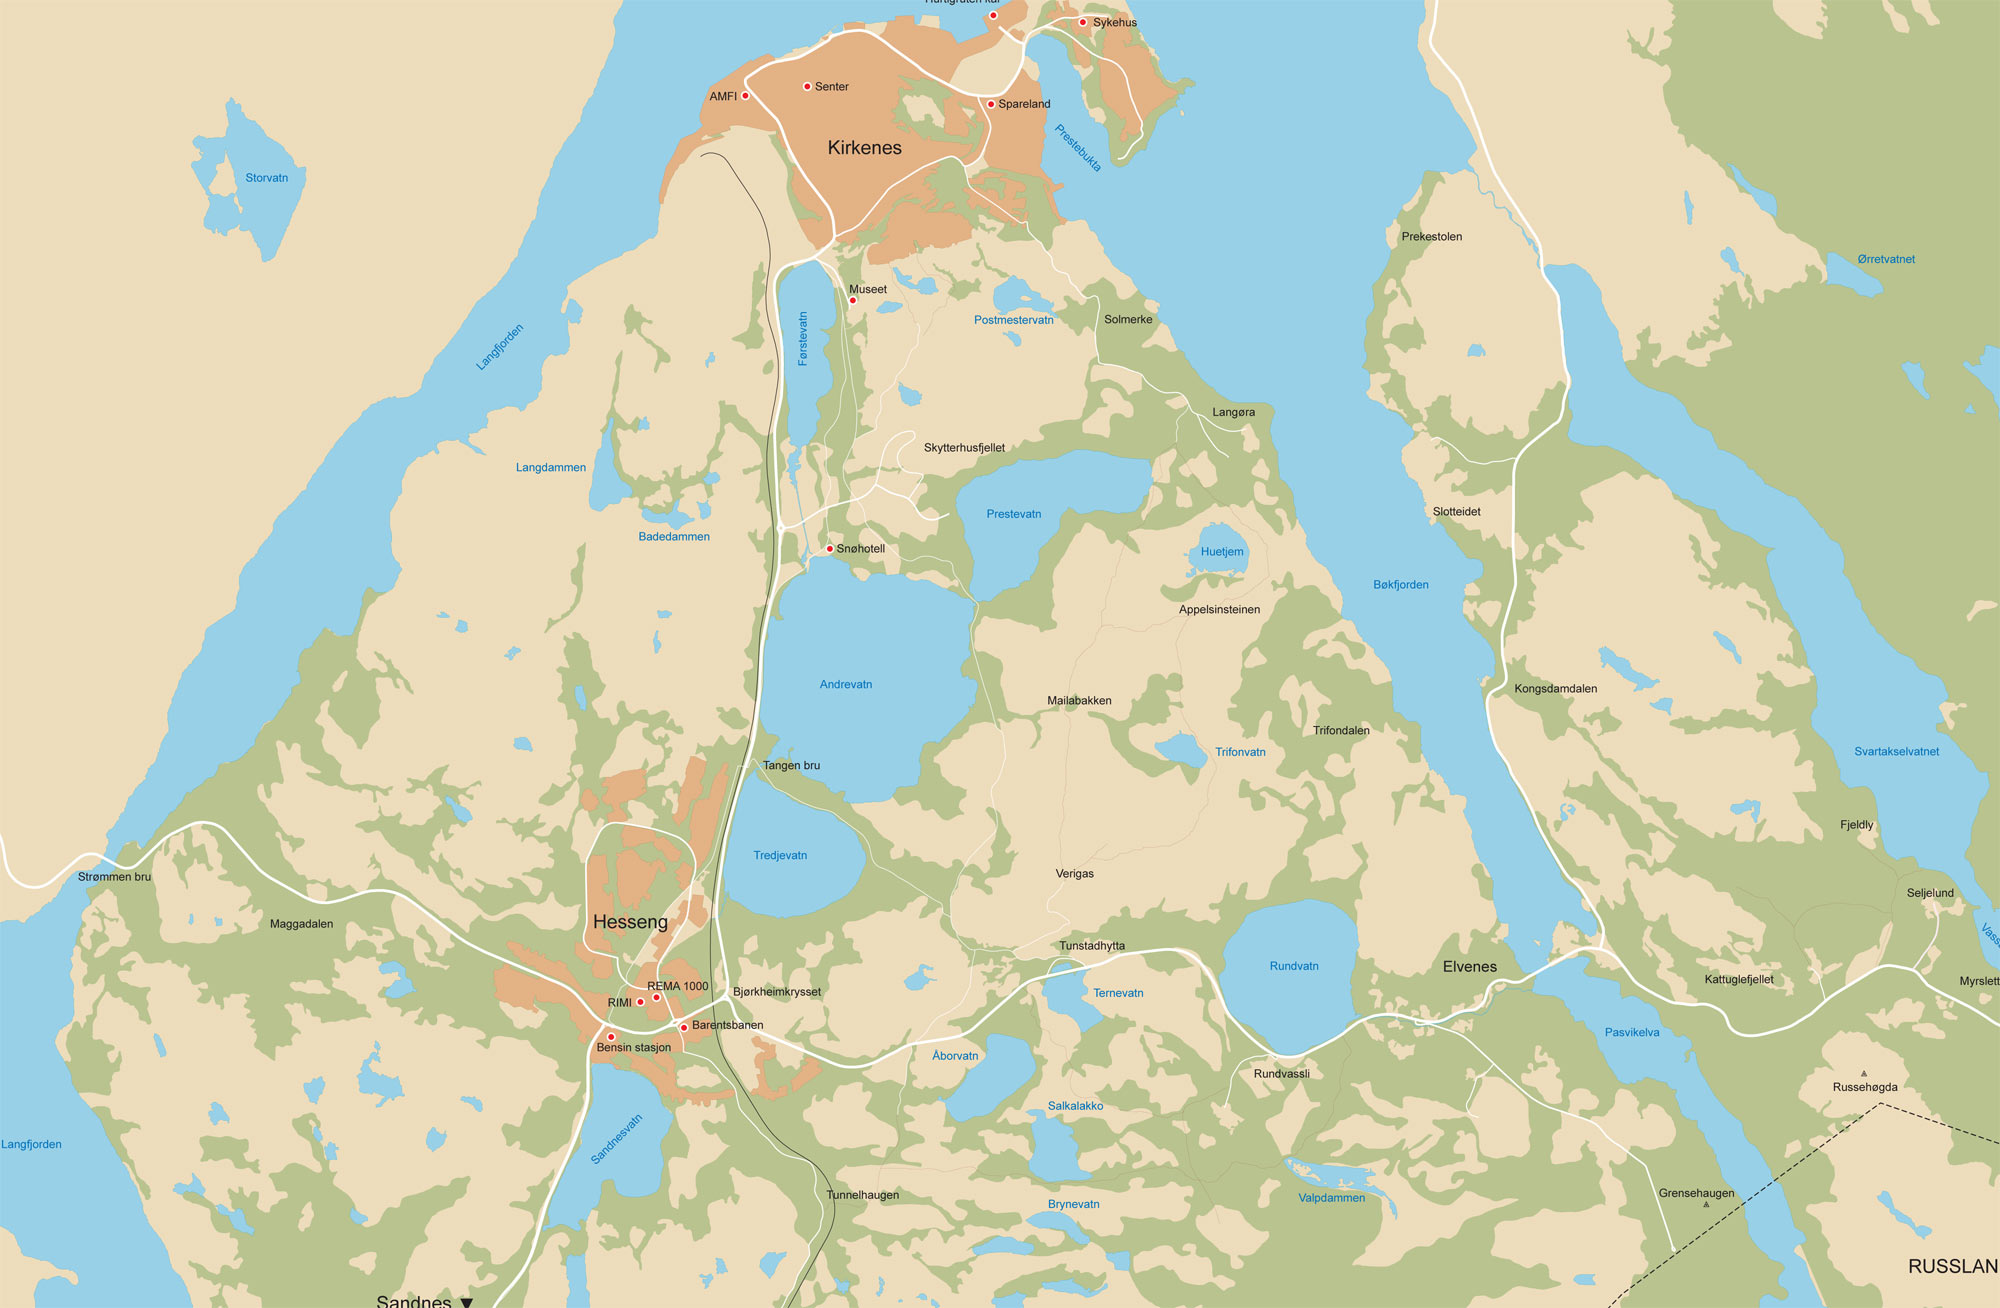
Kirkenes area map Ongoing work on Kirkenes map for Russian shoppers. 2013.
Zelenograd bus routesStill I cannot remember which bus goes where in Zelenograd. A couple of times I got the wrong bus, going to my job or home, so the desire was to map routes once and for all. I've chose to show just internal routes, where my monthly ticket is acceptable. 2013-2014.

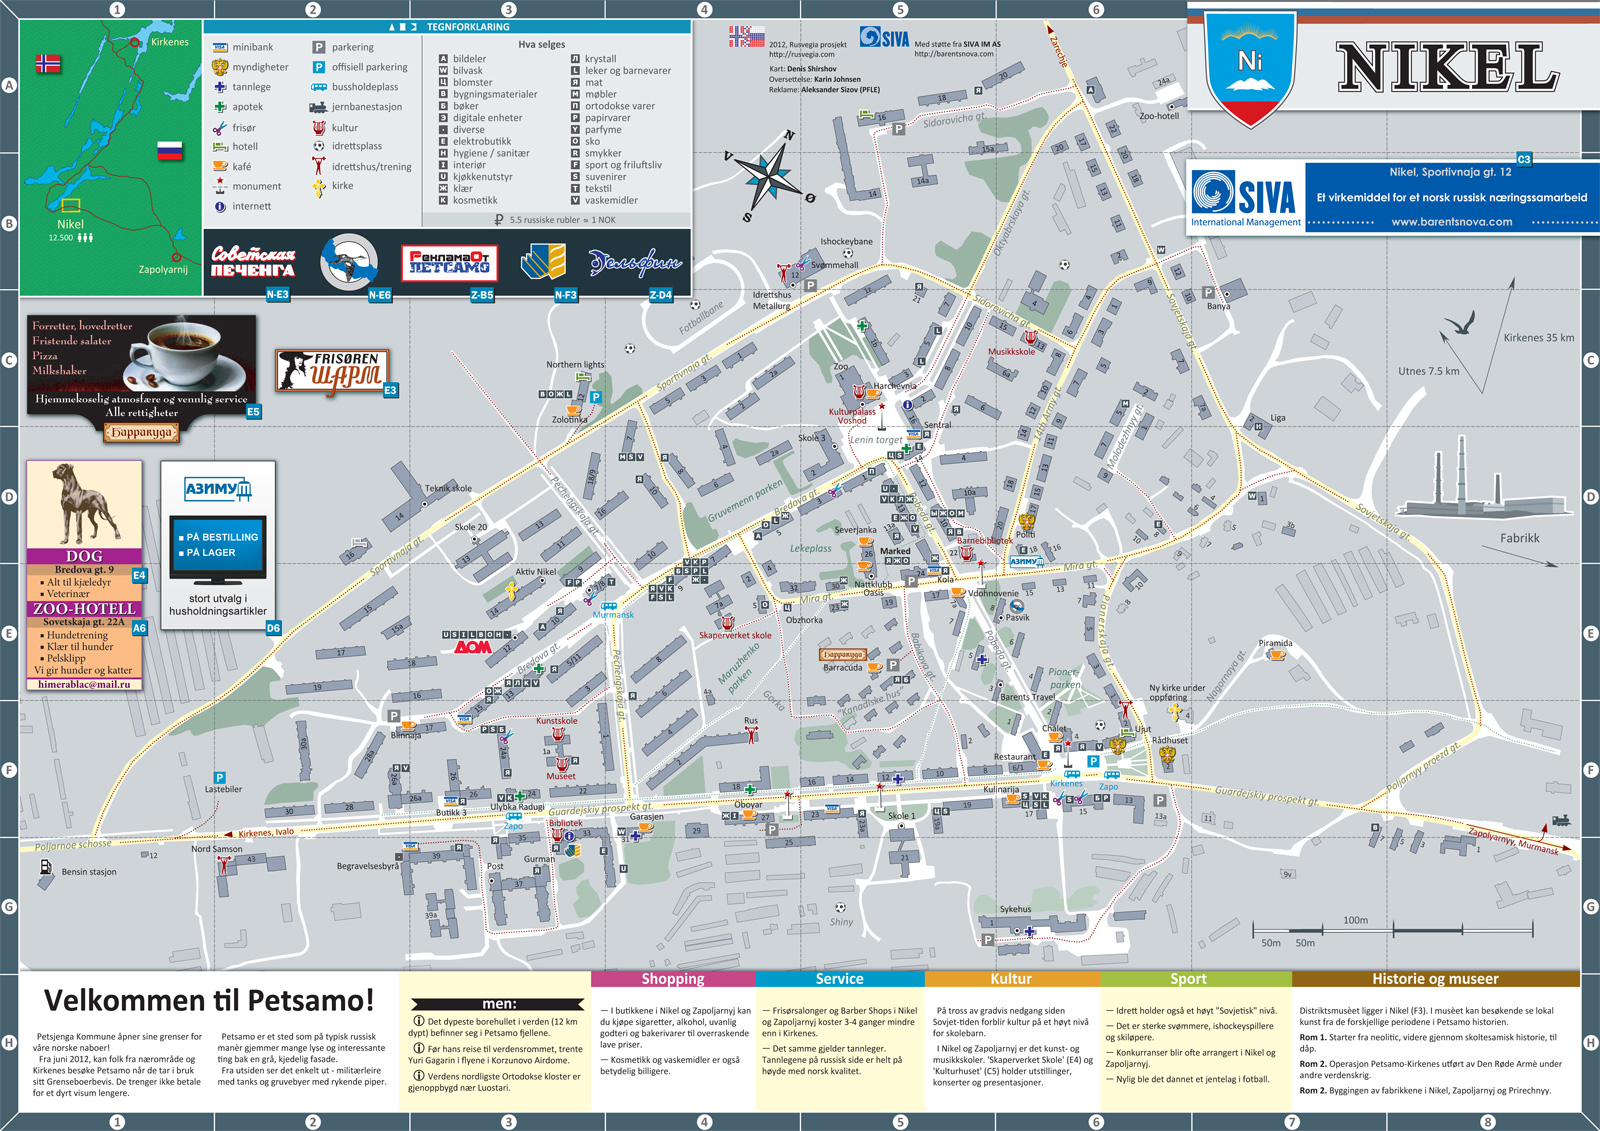
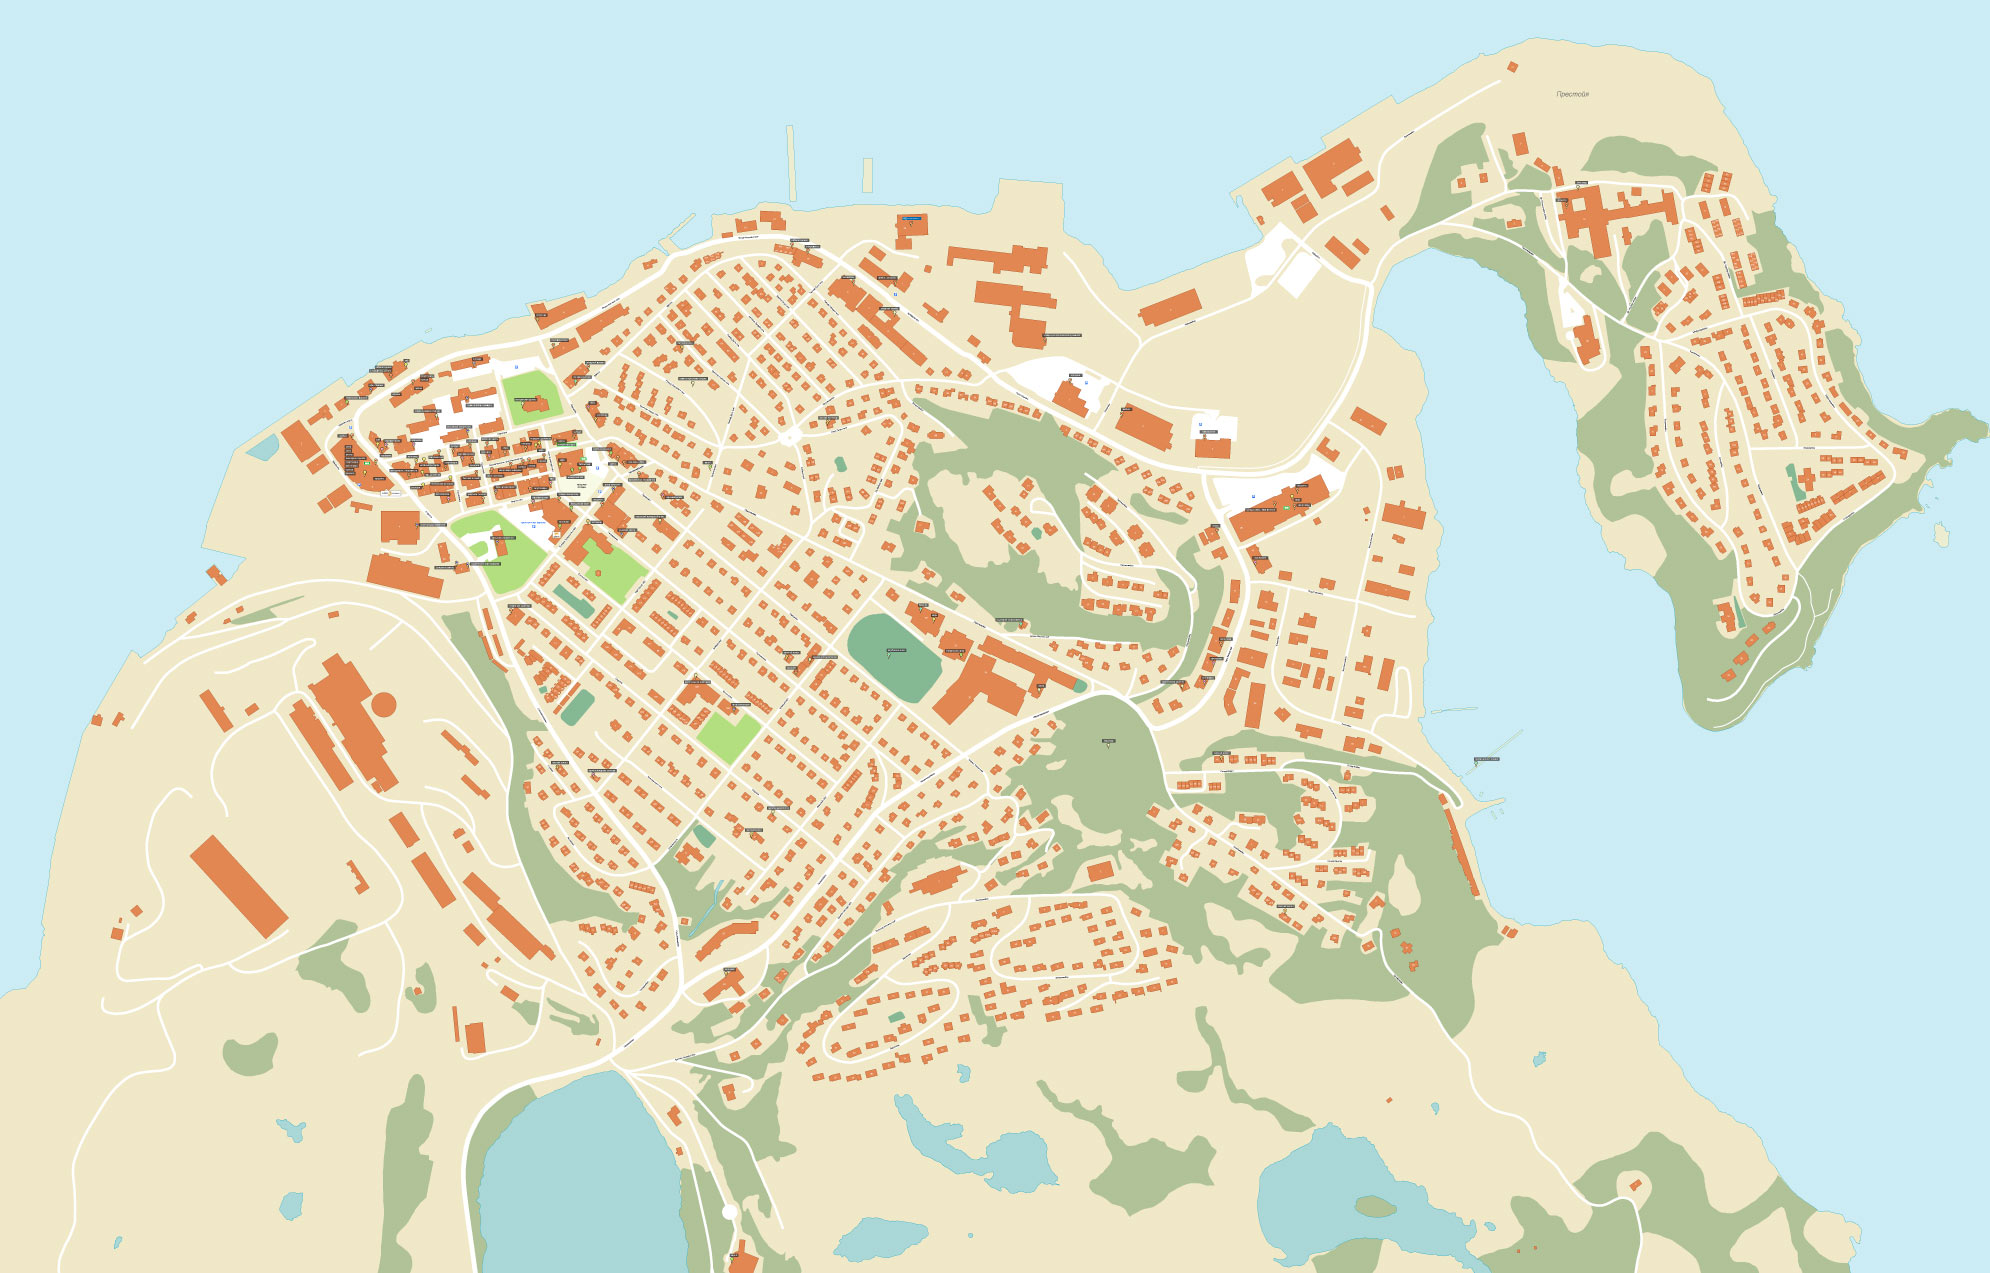
Nikel map Standalone A3 version. Popular among local Norwegians that have grenseboerbevis - a card, that allows to enter Russia without visa. All design is mine. 2012.
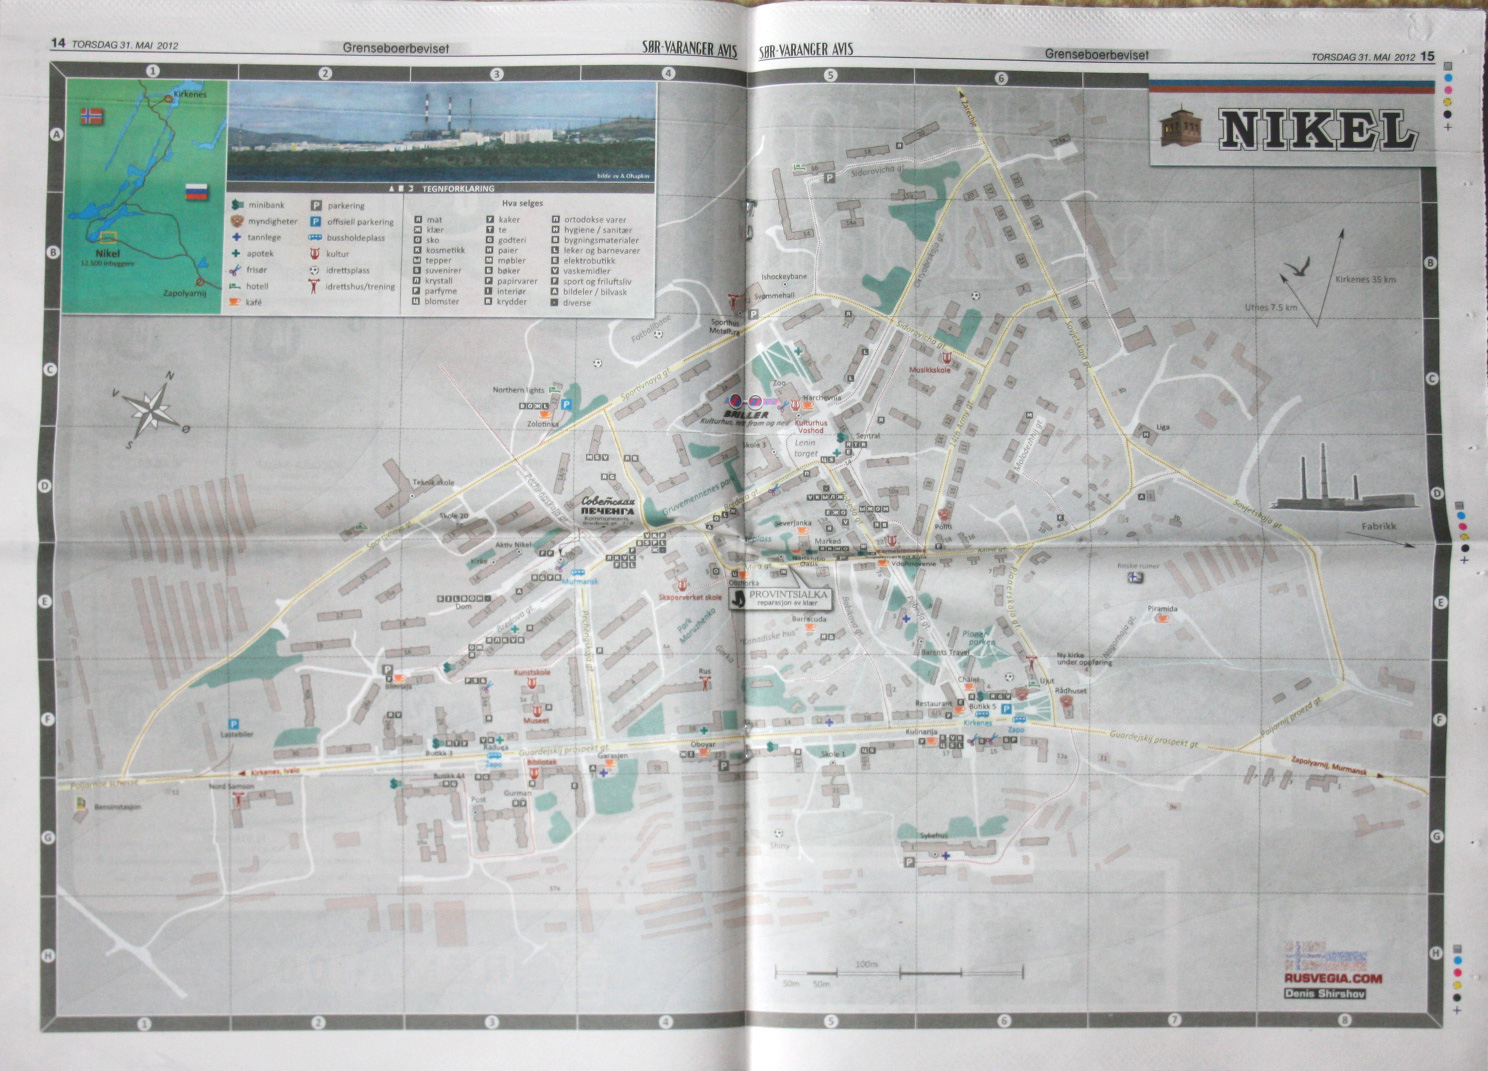
Nikel map in the newspaper Version printed in the Kirkenes newspaper Sør-Varanger Avis. It was the first map of neighbouring Russian town published in the Norwegian newspaper. 2012.
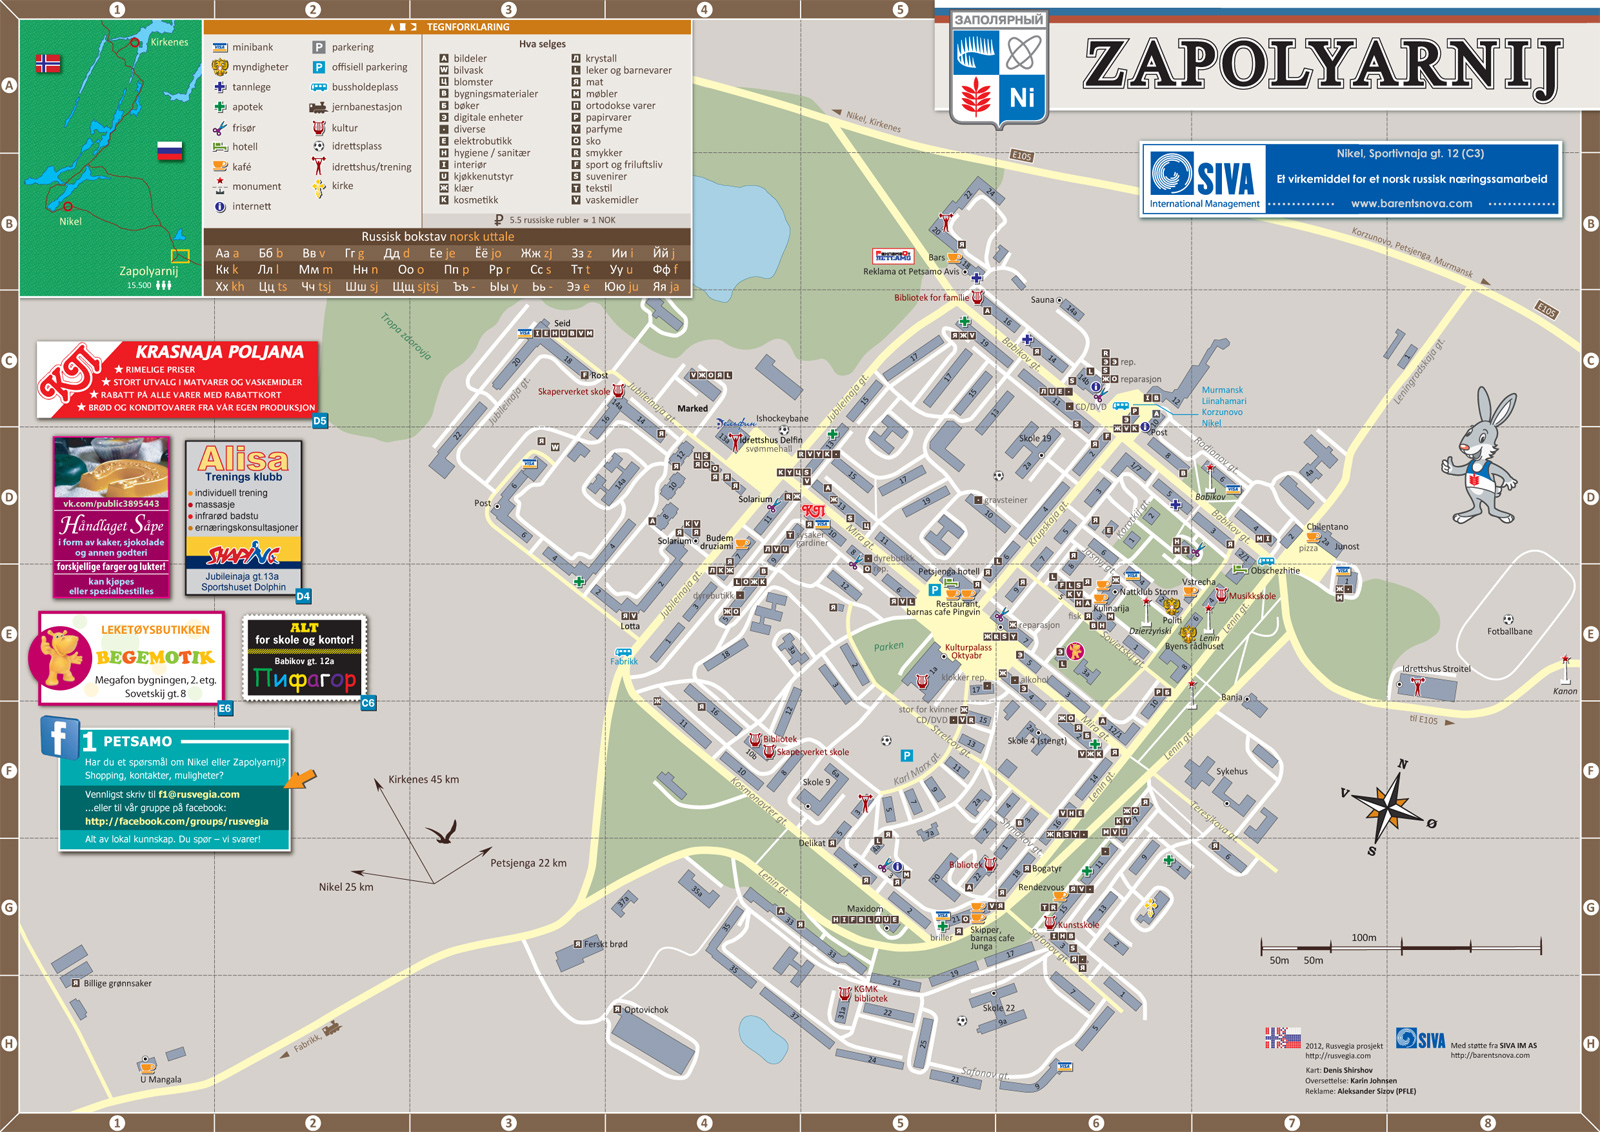
Zapoljarnyy map Standalone A3 version. Before publishing this map, no one knew what is there inside Zapoljarnyy. How buildings and streets relate to each other. The town was covered by a mist of uncertainty. 2012.
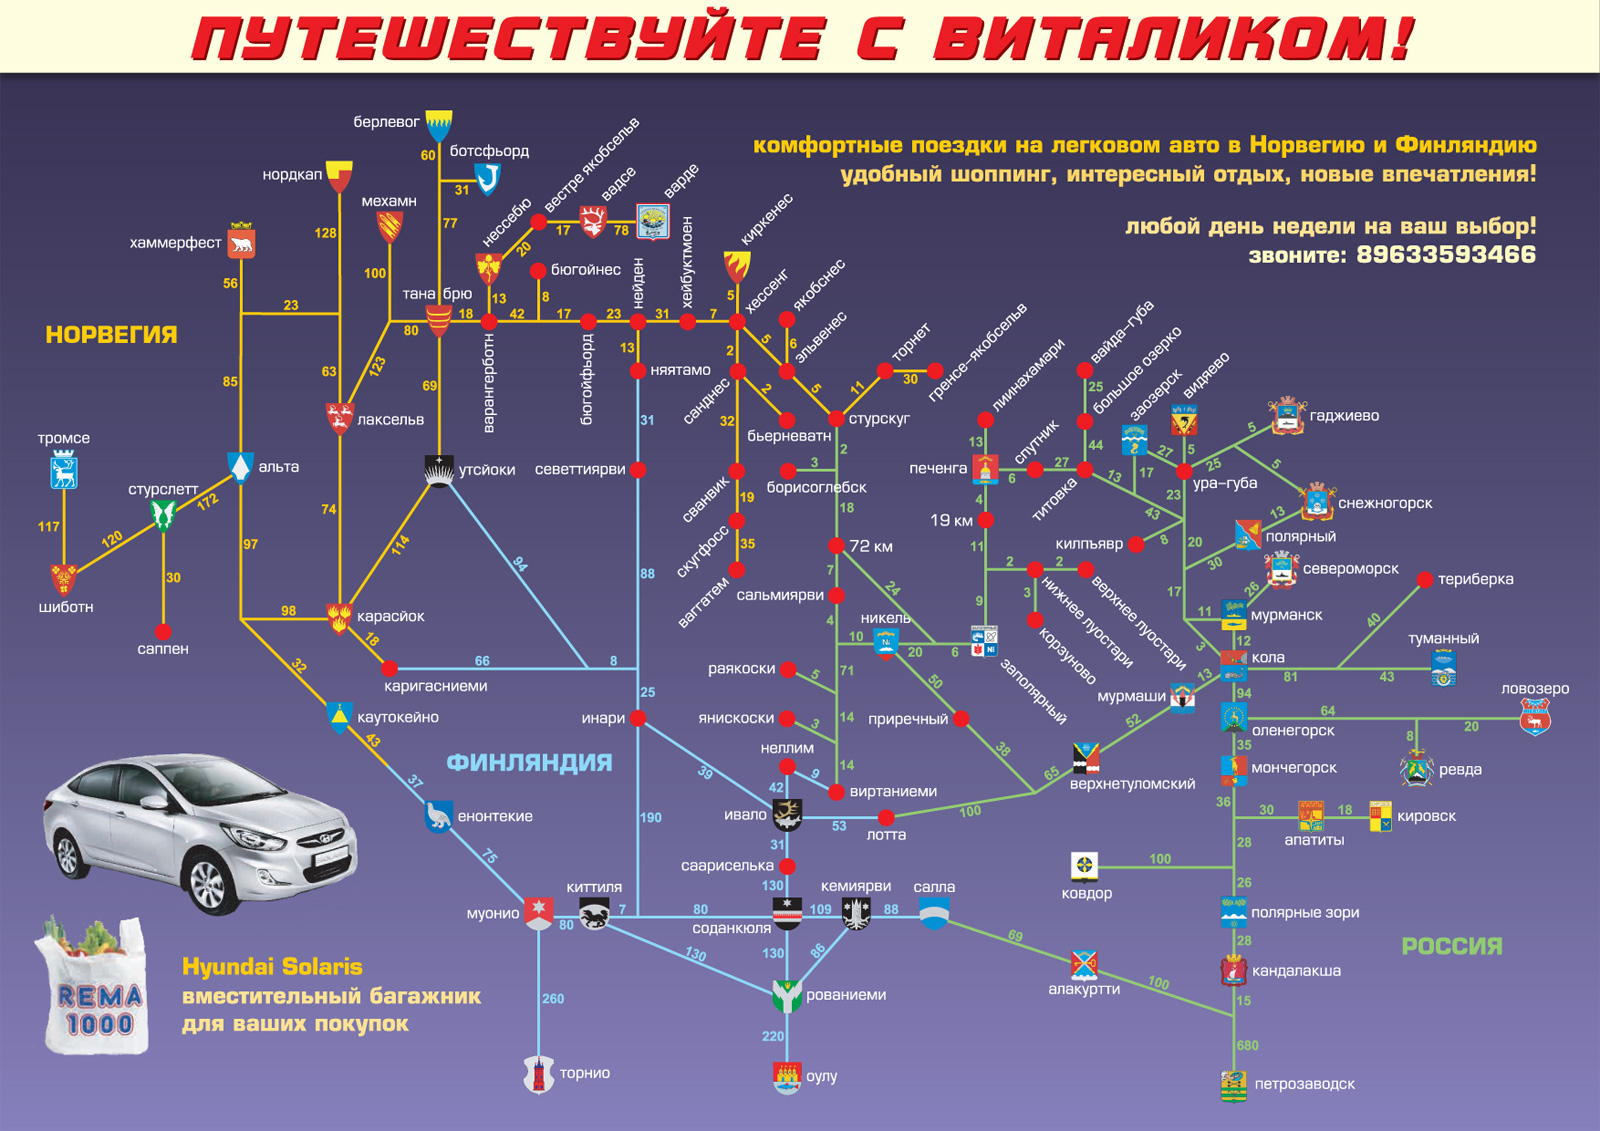
Interactive air pollution chart The same chart, but for use in browser. The data is taken from google docs spreadsheet, that makes the update process easier. Interactivity is reached through use of d3/svg. 2013.
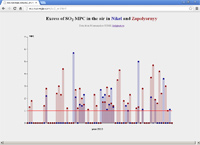
Air pollution chart Overflows of maximum permissible concentration during two months for Nikel and Zapolyarnyy mining towns. 2013.
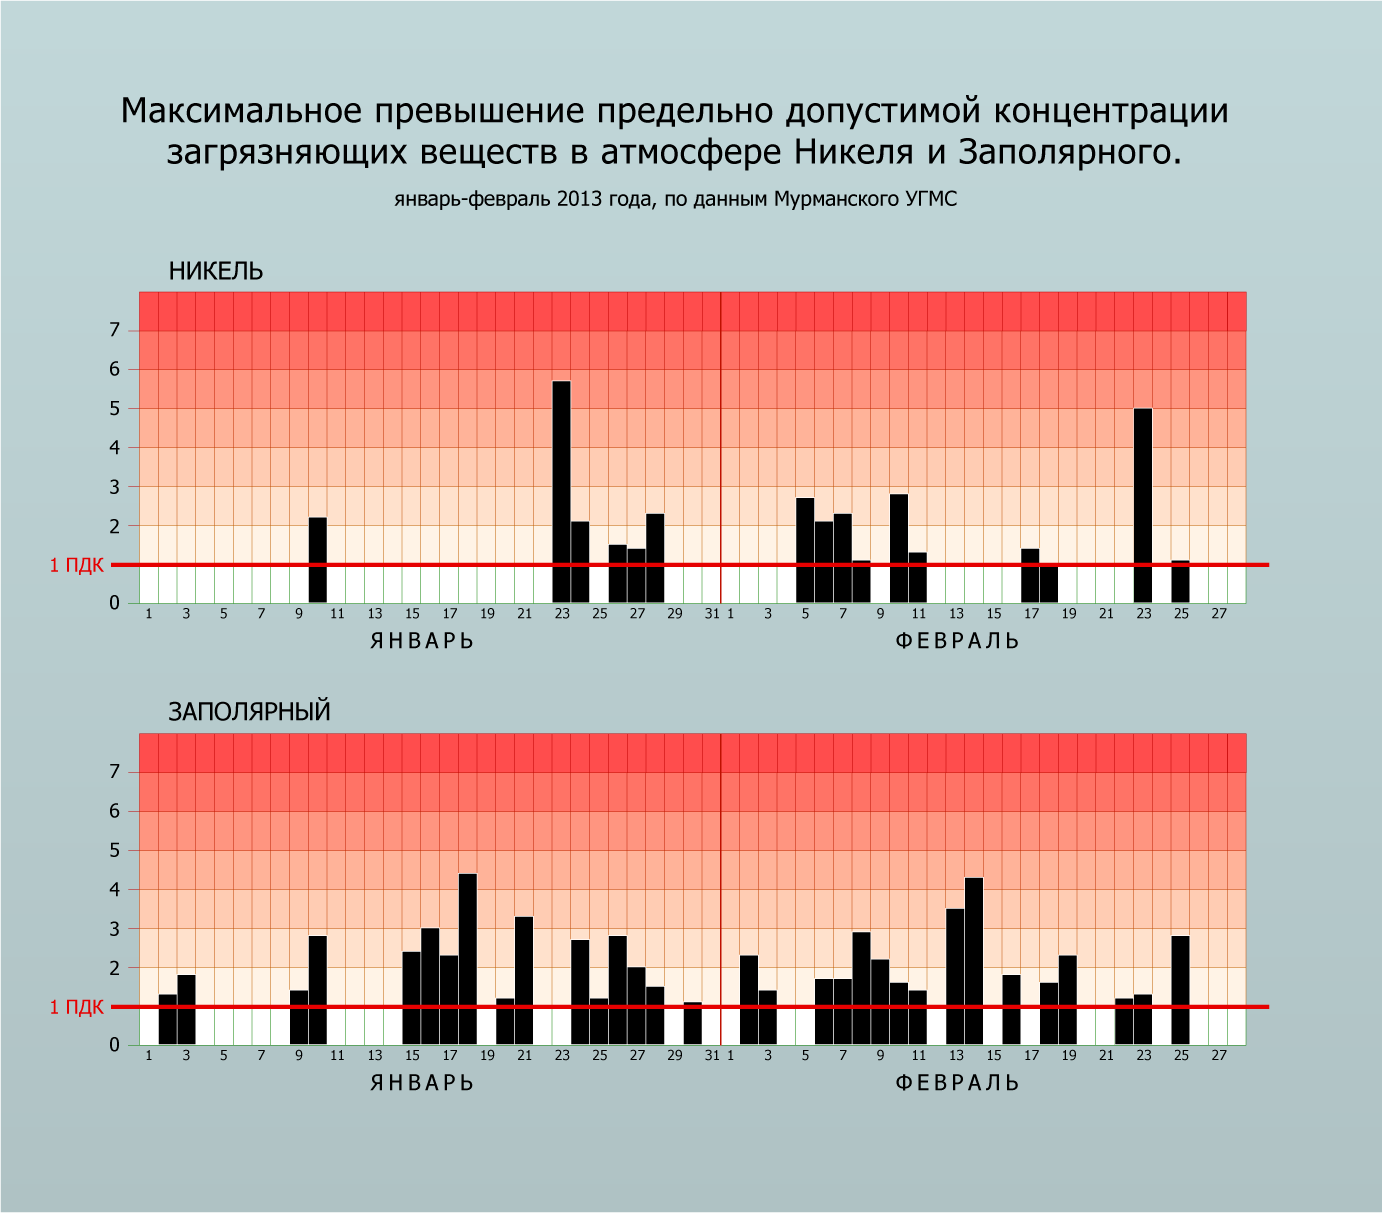
Number of bordercrossings through Storskog station Data collected from month report plots at politi.no Then I generated a barplot in R. In the last step, having exported barplot to Adobe Illustrator as a base, I elaborated a better layout. 2013.
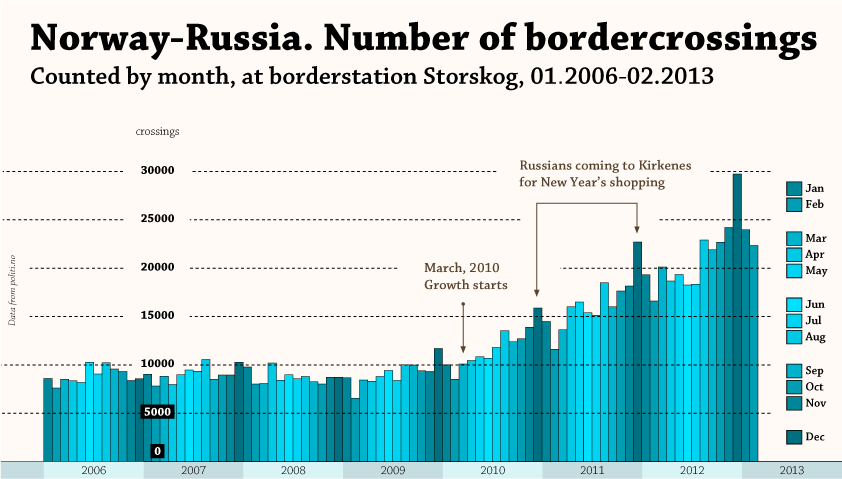
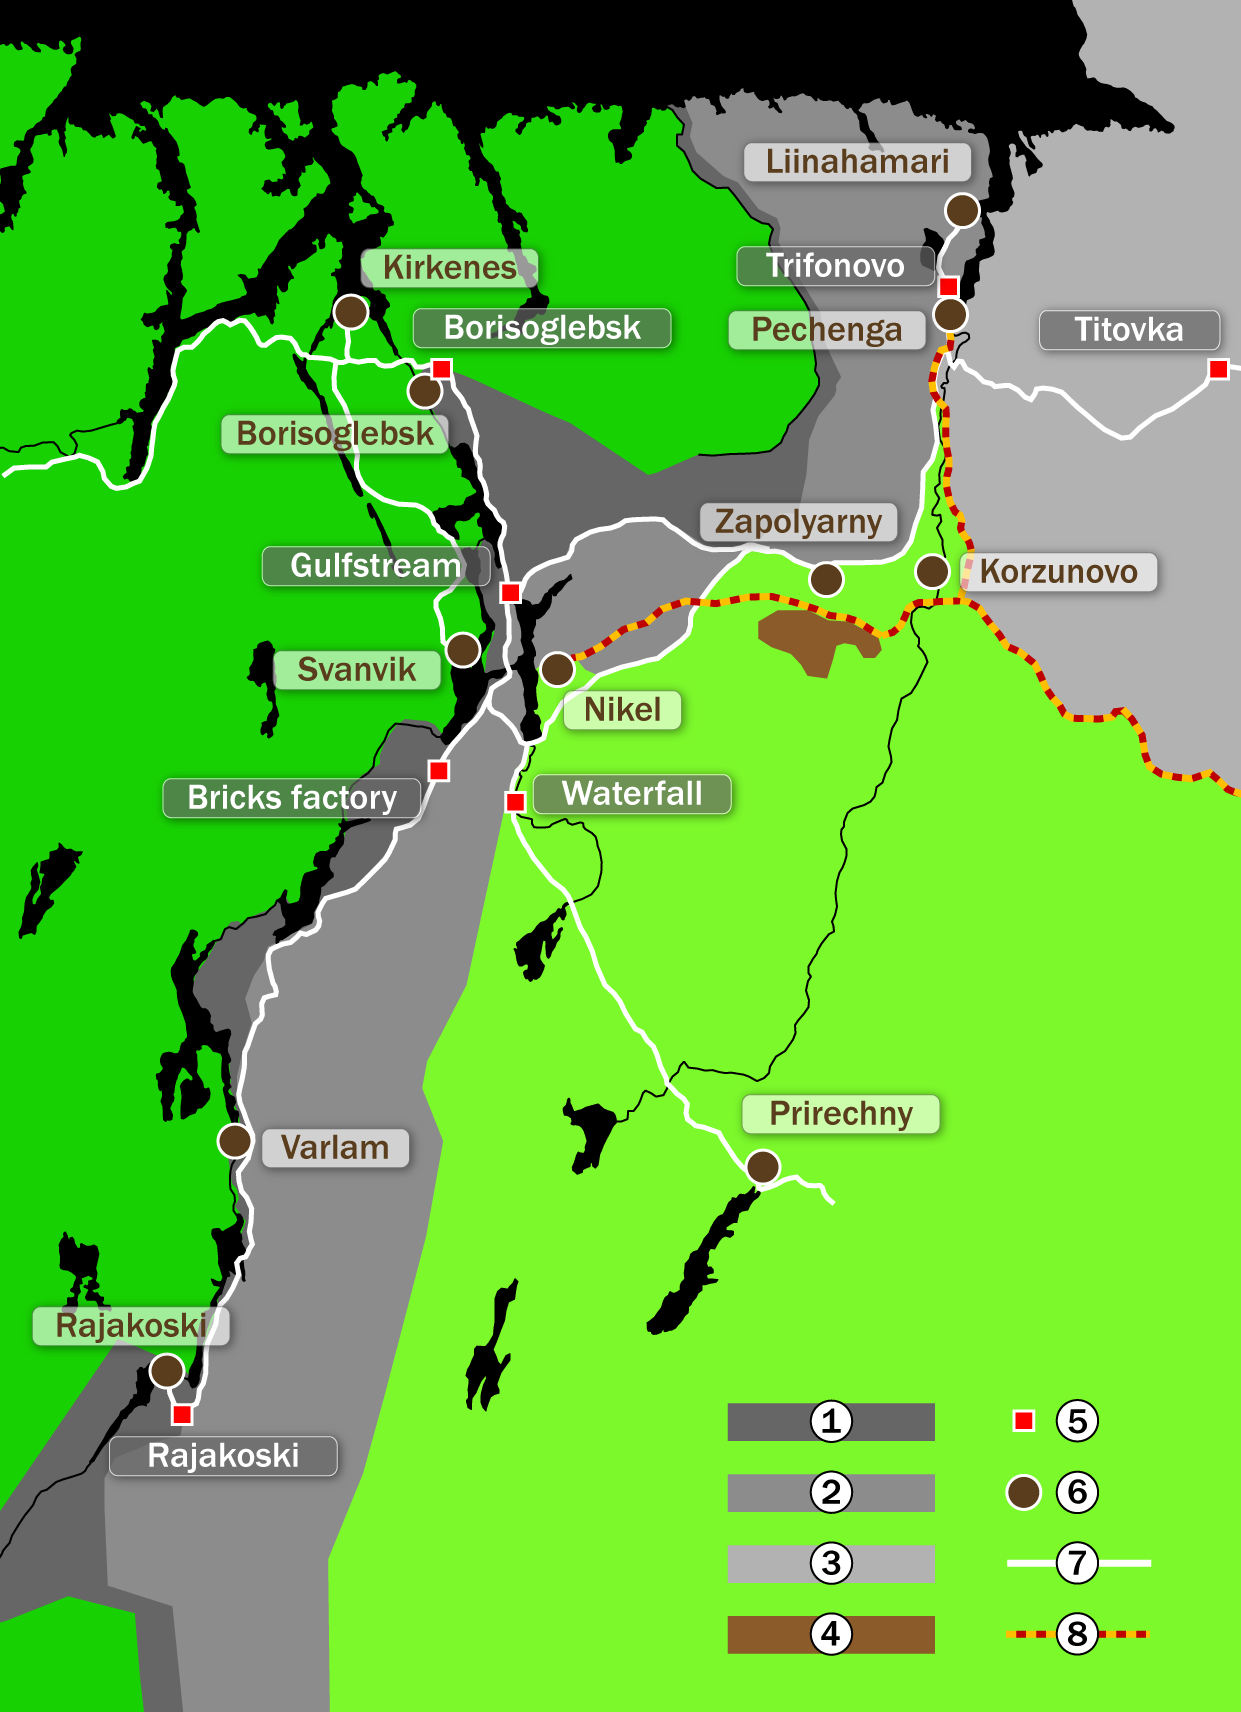
"Travel with Vitalik!" Advertisement of car trips service. In the scheme are shown towns and municipalities of Russia, Norway and Finland around Nikel. Useful distances between places. 2012.
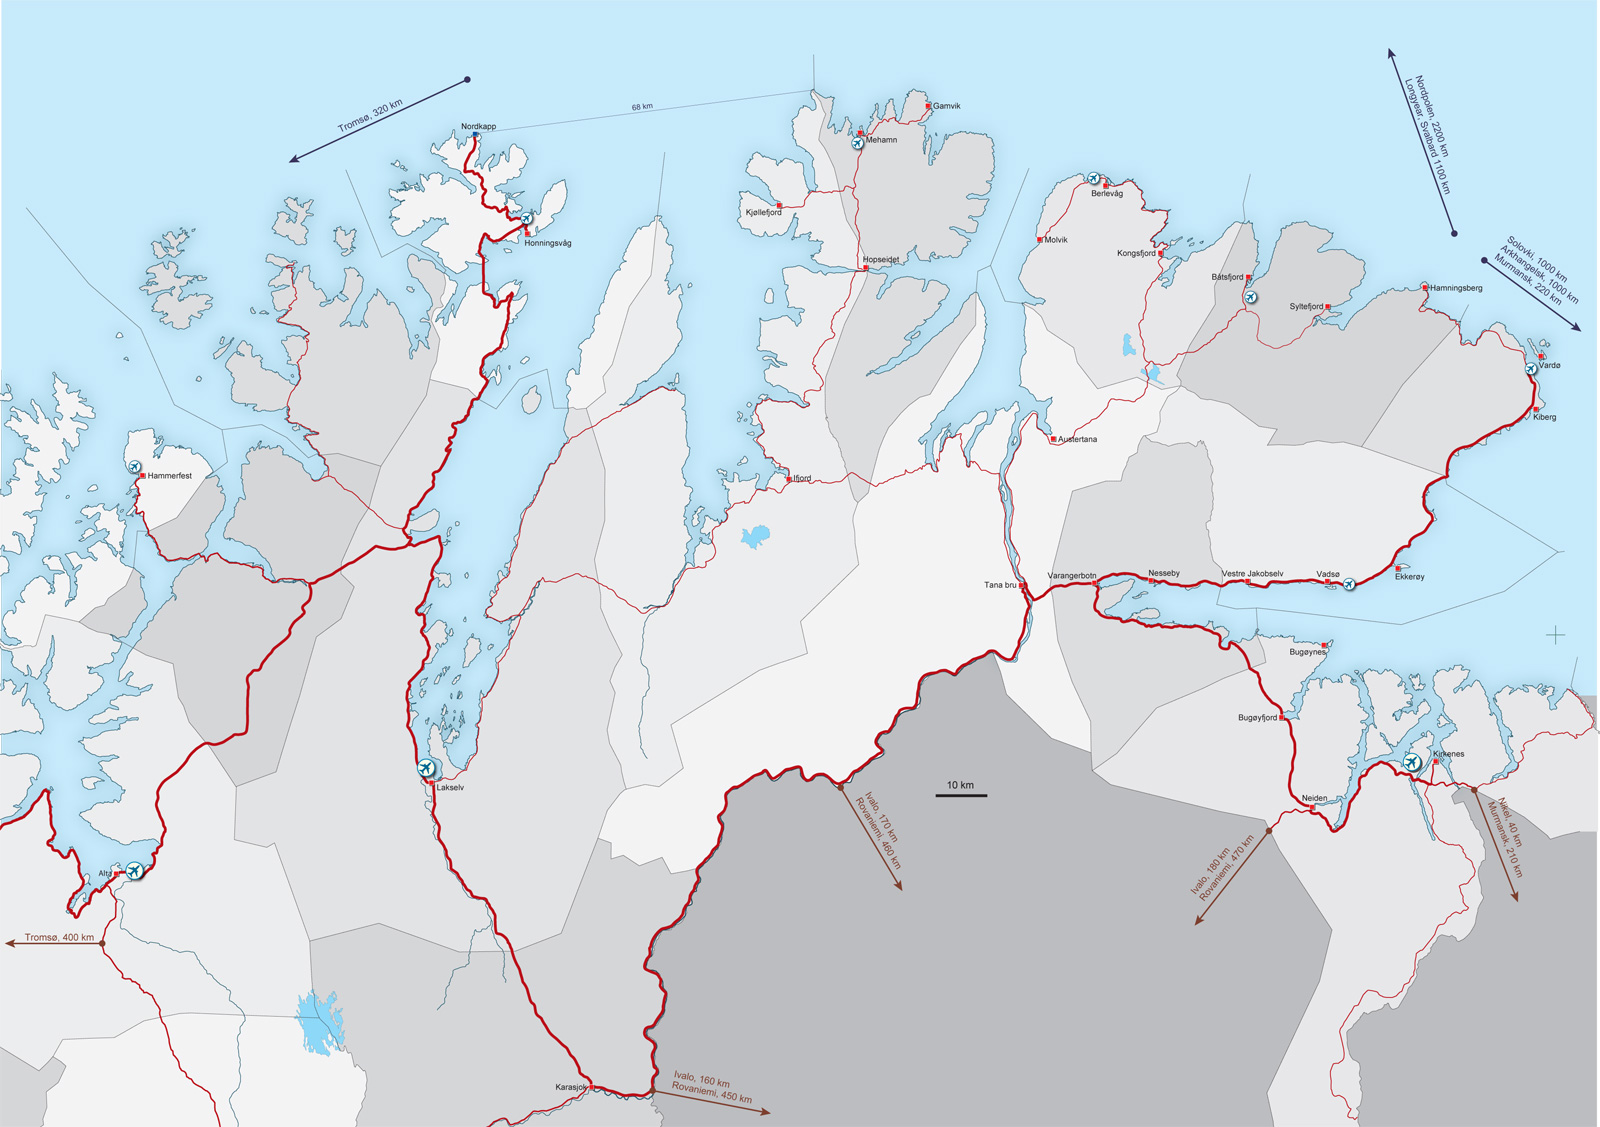
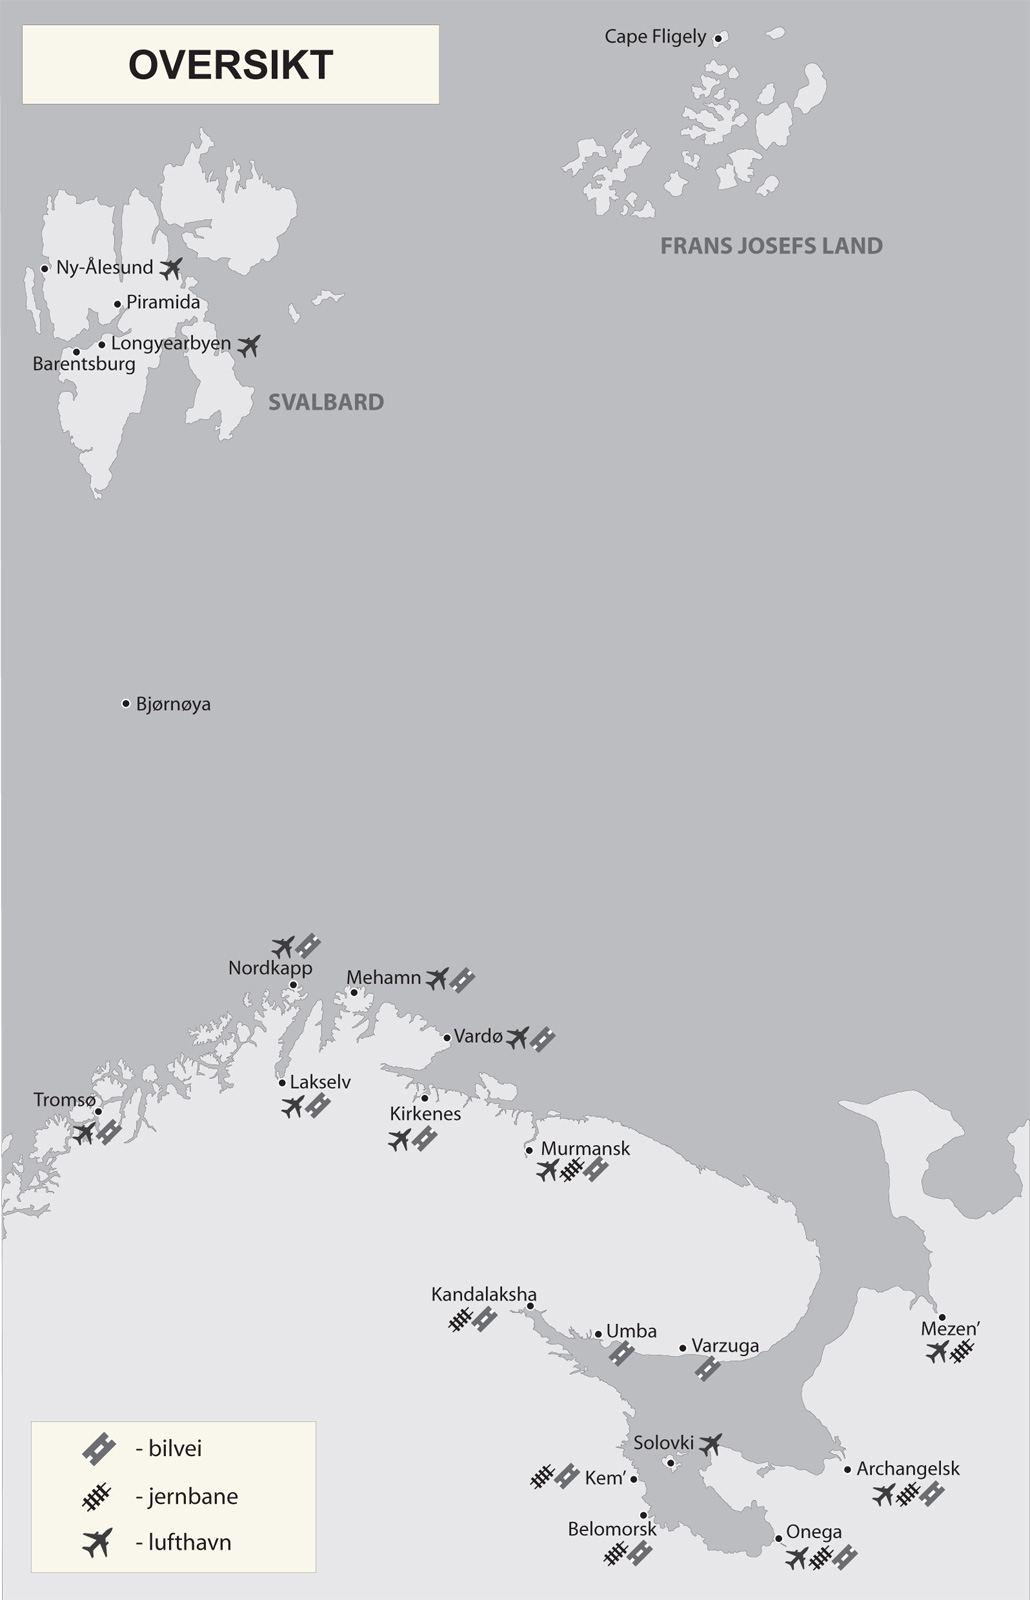
East of Nordkapp The coast east of Nordkapp with key places and transport infrastructure in the perspective of tourist flows. Prepared for a seminar in Vardø. 2012.
Nikel subway Joke map of Nikel subway. Seems to be that old nickel ore mines are used by Russians now as the subway routes. 2012.

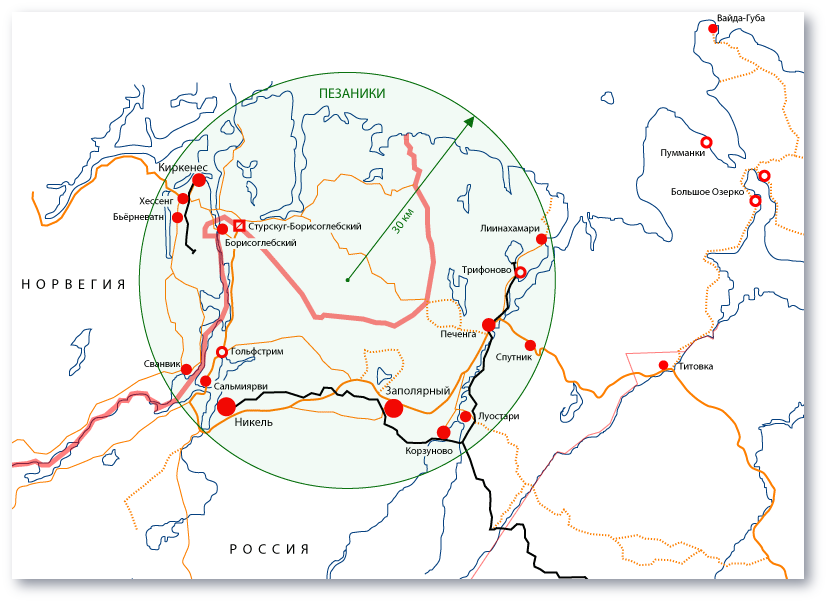
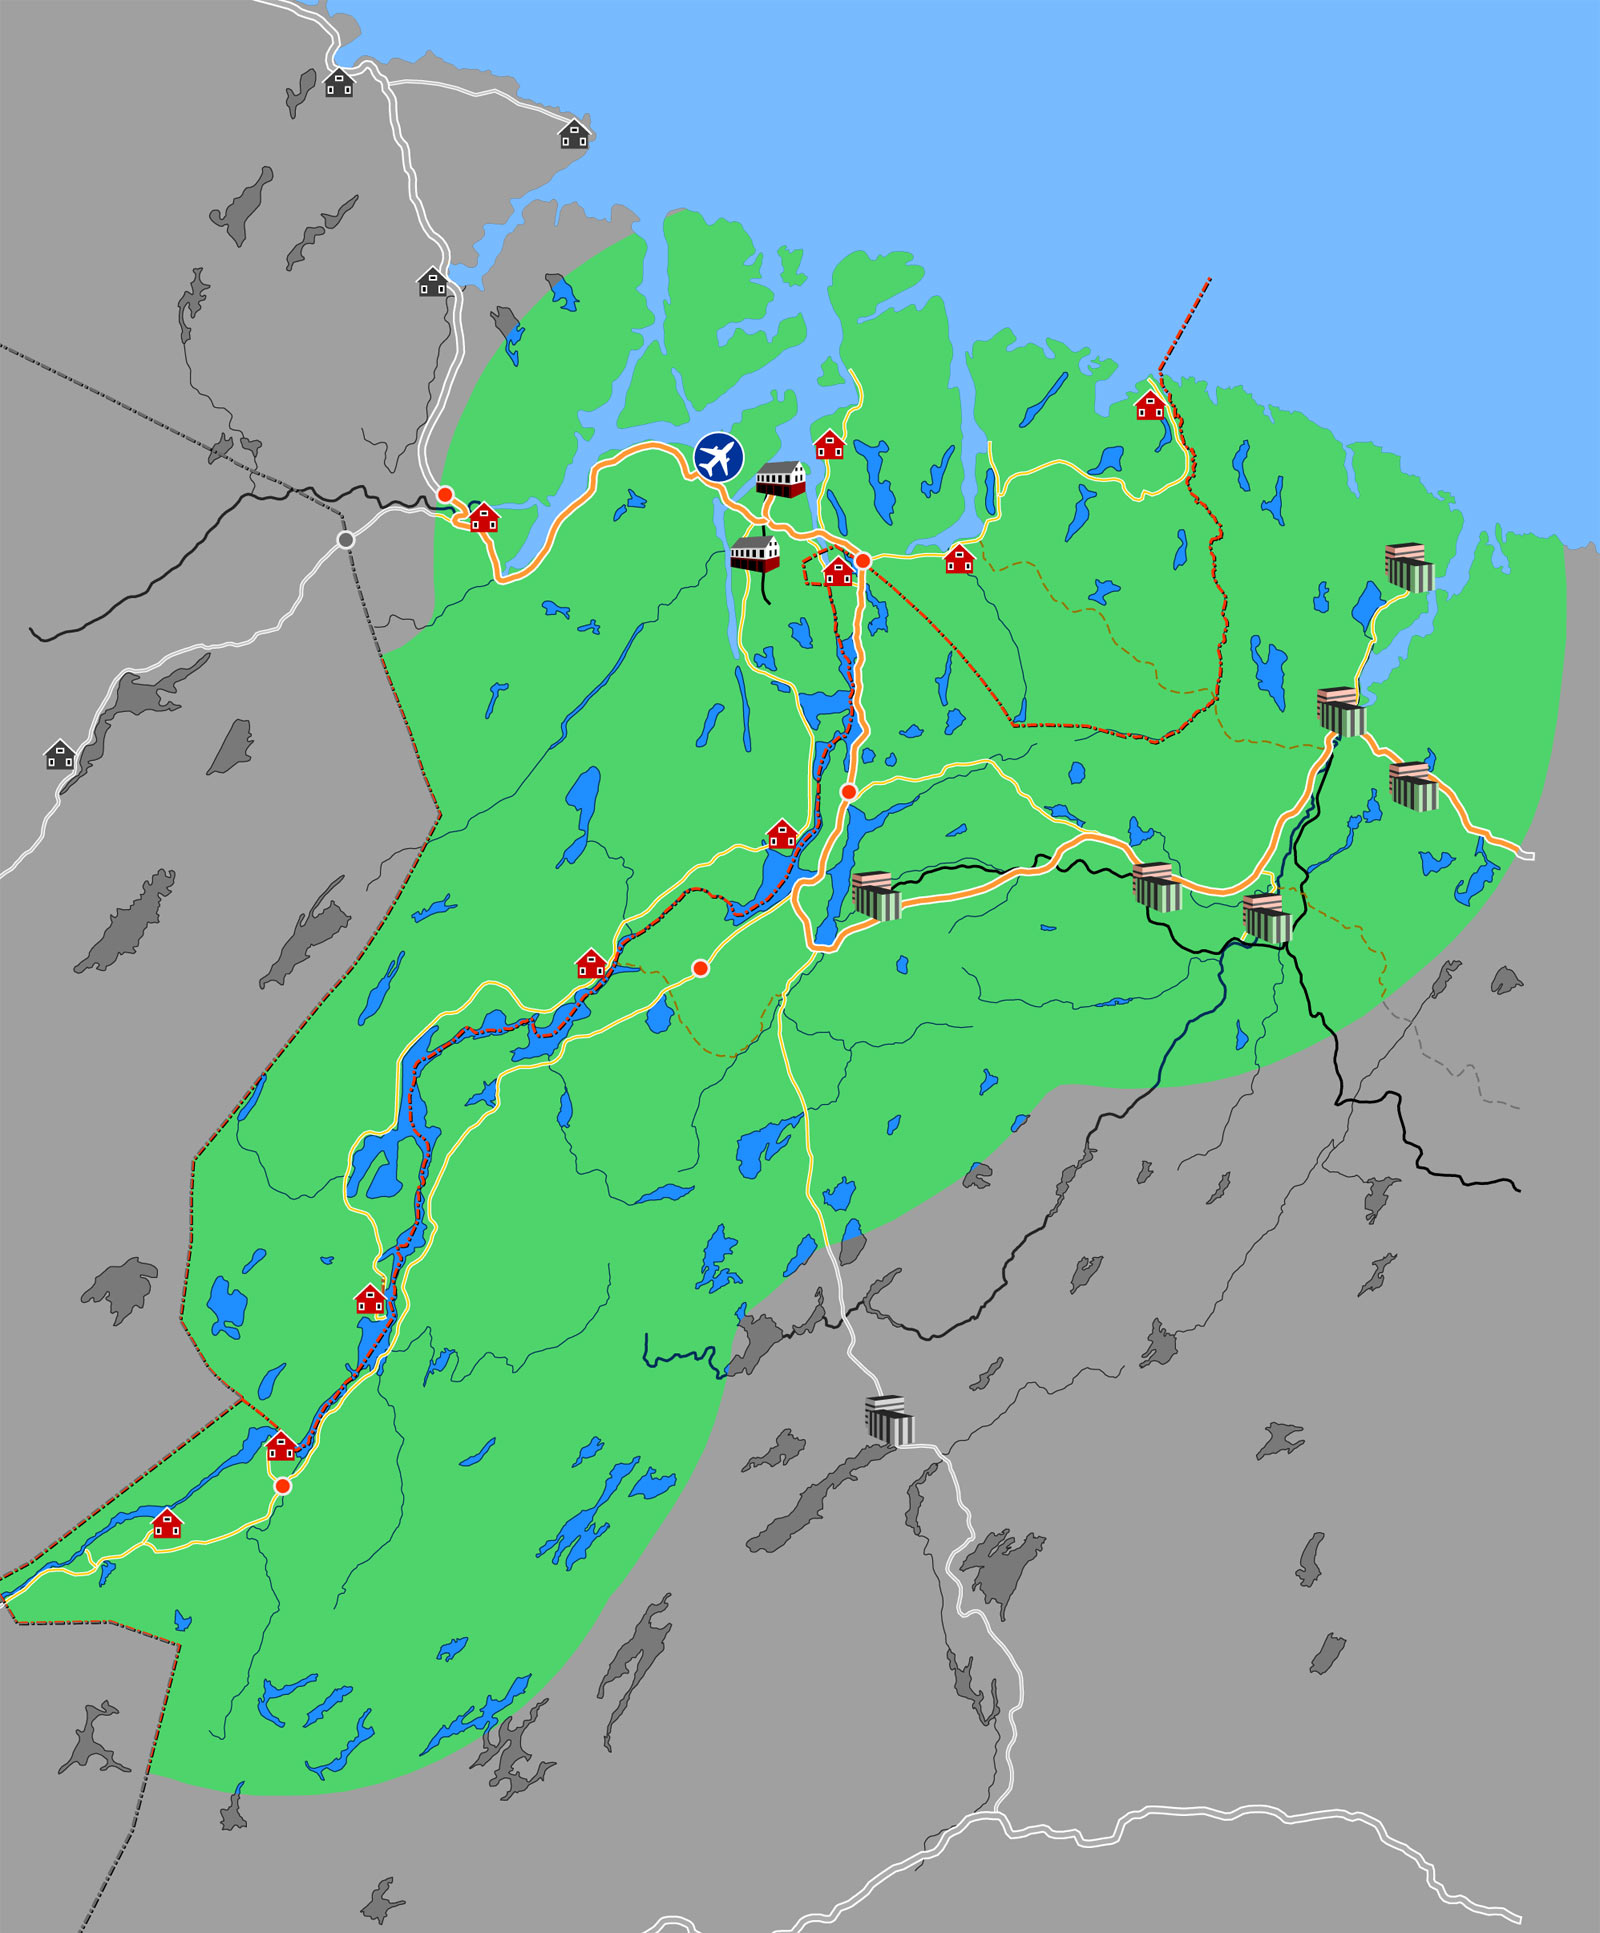
Green area Visum-free area Norway-Russia. Noone knows where the visum-free area ends in Russia. Here is a brave attempt to show where the brim of the area can be. 2012.
Borderzones In the severe reality of continuing Cold War one must not to mix borderzone with grenseboerbevis area. While the first is restrictive, the second is welcoming. This map is to help understanding existing restrictions on the territory of Petsamo district. 2010.
Geographical distribution for group members in vk.comMapping vk.com social network group participants on the map of Russia. d3.geo, bunch of csv files and newlisp scripts. 2013.
Kirkenes from online map project rusvegia.com The project intends to be a good (the best!) source of information for ever increasing number of Russian shoppers in Kirkenes. 2012-2013.
Kirkenes area This is an area around Kirkenes. With paths, skitracks and smaller lakes. Definitely is a place for hiking! 2012.
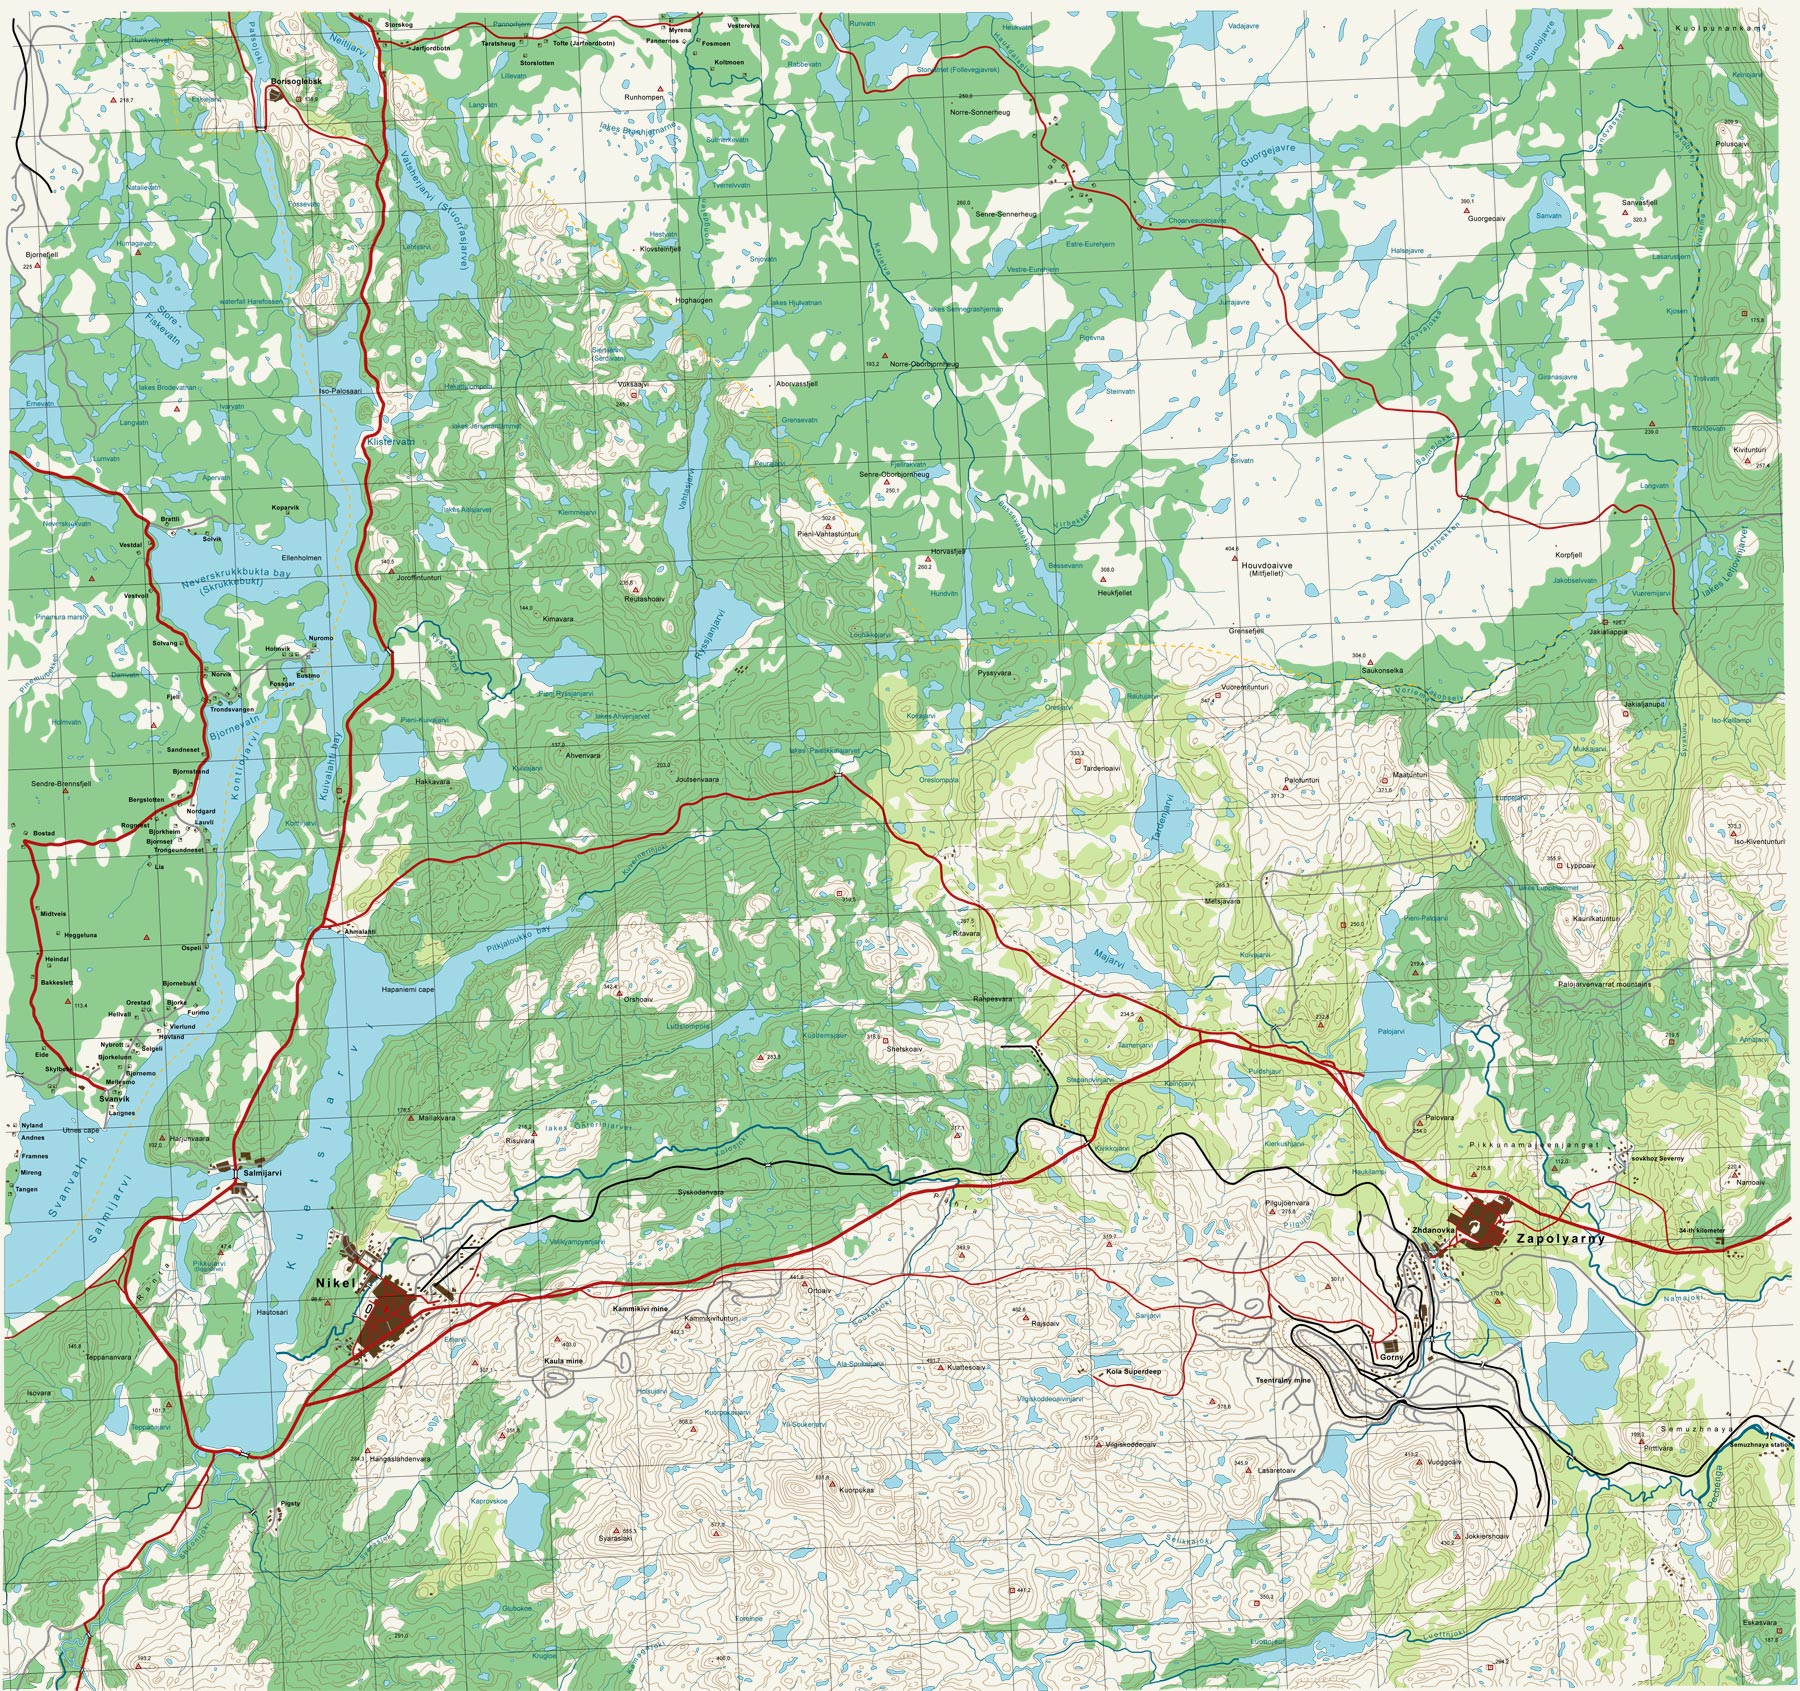
Northern Petsamo tunturi The part of land between mining towns Nikel and Zapoljarnyy. Originally in Cyrillic translated into Latin. Don't ask me how many hours I spent, drawing all the lines by mouse on the slow Pentium 2. 2007.
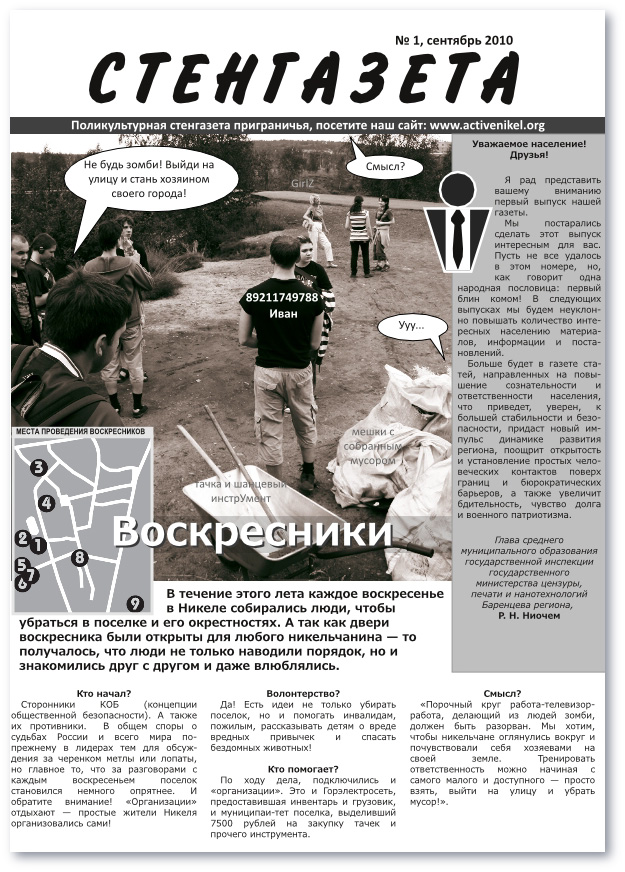
Actions in the town Cut from the self-made newspaper of volunteer organization "Active Nikel". Shows the places of cleaning actions in Nikel. 2010.
Barents sea A picture from Vardø Cruise seminar invitation. 2012.
Pezaniki Notion of the quite close area on the border Norway-Russia. It might be realized that in future some megapolis could appear on the place between five urban areas. And I dub thee Pezaniki City! 2007.